What Should Happen
As the maxim says, all models are wrong, but some are useful. Let's parse the usefulness of this one.
Things are surprisingly quiet on the transfer portal front. Virginia Tech’s portal entrees generally fall into one of two categories:
Guys with one year of remaining eligibility looking for an extended NFL tryout (i.e., they need to pad their stats)
Guys buried in the depth chart looking for a fresh start and maybe a better fit
So far, there is nothing of interest on the portal front from a data analysis perspective (which is probably a good thing). Pry & Co. have done a good job of retaining their young core.
Portal prelude aside, before launching into the Virginia Tech CFP, I thought it might be helpful to provide a thorough examination of what the new model can and cannot tell us. My goal is to keep this at high enough level that the general fan can fully understand and processes everything, but provide enough detail so that when I launch the simulated games next week, everyone will have the necessary background to contextualize the results.
How it Works
Like the in-season model, this new one is a multivariate model that looks a whole host of advanced statistics and creates the best “fit” for the predicted field. Each formula includes at least 20 variables. Variables are either game specific (pre-game ELO rating, home/away, regular/postseasons, etc.) or team specific (offensive passing play EPA, defensive front seven havoc, etc.). Team specific stats encompass the entire season. Remember, the aim is to predict how Team X will do against Team Y. Team X is the aggregation of all its advanced season stats (each team plays one season) and how it will perform will depend on Team Y’s unique strengths and weaknesses (the aggregation of that team’s advanced season stats) when placed in a particular game environment (game specific variables). Two variables of interest that are not included are injuries, for which there is no quantitative stat tracked, and betting lines (the dataset is incomplete). One variable currently not in the model that I might add before the games commence is weather (likely temperature at kickoff).
What Should Happen
The greatest value of this model is that it predicts what should happen in a given matchup. In most cases, what should happens is what actually happens, and that is reflected in the following predictions vs. the actual scores:
2004 VT vs. Western Michigan - Predicted 63-0, Actual 63-0 (no variance in score differential)
2005 VT vs. Boston College - Predicted 34-13, Actual 30-10 (1 point variance)
2008 VT vs. Duke - Predicted 21-9, Actual 14-3 (1 point variance)
2014 VT at North Carolina - Predicted 35-21, Actual 34-17 (3 point variance)
2020 VT at Wake Forest - Predicted 25-34, Actual 16-23 (2 point variance)
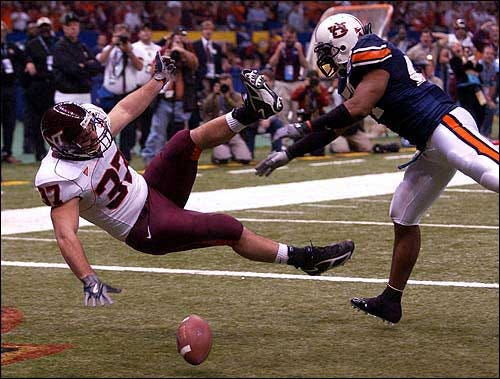
However, sometimes what should happen does not. A perfect example of this is the 2005 Sugar Bowl (following the 2004 season), which saw Virginia Tech face off against Auburn.
What did and did not happen at the Sugar Bowl

Entering the game, Auburn was undefeated, ranked #3 in the final BCS standings, and still smarting from their National Championship game snub. Virginia Tech, conference champions in their first year as ACC members, entered with a 10-2 record and #9 BCS ranking.
The Hokies were decided underdogs, or so we all thought. And when I say all, that includes the Hokies’ head coach:
Frank Beamer said he thought Auburn should be in Miami playing for more than pride, and had so indicated in his ballot in the coaches’ poll. “I certainly believe, and the way I voted, is that (Auburn) should be playing in the national championship game,” Beamer said. “I think anytime you go through the SEC and the title game in that league, you deserve to play for the national championship.
“But things are as they are.”
The question is, was Auburn really that much better than Virginia Tech? Were they better, period? The model doesn’t think so. The model picked the game 24-16 in favor of Virginia Tech (the away team on a neutral field). It nailed the Auburn score, but overshot the Hokies’ point total by 11. Or, perhaps more accurately, the Hokies undershot their expected point total.
Virginia Tech got off to a slow start in the game. Finally, in the second quarter, the offense gained some traction. Trailing 6-0, QB Bryan Randall drove Tech inside the Auburn five yard-line.
On fourth down, passing up a field goal and with everyone expecting another power run, Randall rolled out and flung a pass between two defenders to sophomore fullback Jesse Allen – who had it for an instant, then dropped it. The ball may have been brushed by a defender’s finger, but no one was certain.
“I wasn’t sure if it was tipped or not,” Allen said. “Randall usually puts the ball in there where you can get it. It was my job to catch it.”
Coach Frank Beamer explained his rationale in going for seven points instead of the almost sure three at that point thusly: “We had a chance to go up 7-6, and I felt we were lucky to be down (just) 6-0 at that time,” Beamer said. “I felt even if we don’t make it, we’d have them backed up.”
And Auburn was backed up, until it wasn’t. The Tigers drove 92 yards to set up a short field goal. They took a 9-0 lead into halftime. At this point, Tech had left seven points on the field.
Auburn drove the length of the field on their opening possession of the second half to score a touchdown and take a 16-0, which they held at the end of three quarters. Early in the fourth quarter, the Hokies drove to the Tiger 10-yard line. However, the drive stalled, and Tech brought on First Team All-ACC placekicker Brandon Pace, who promptly missed the 23-yard attempt wide left (by an inch). Auburn’s lead remained 16-0, and the Hokies had now left 10 points on the field.
On the ensuing drive, the Hokies drove the length of the field and finally got on the board, courtesy of a 29-yard touchdown pass from Randall to Josh Morgan. Tech went for two, but failed to convert. That made the score 16-6, Auburn, and the Hokies had now left 11 points on the field (the extra point would have been nearly a sure thing).
A few minutes later, with time dwindling and Tech desperate, Randall connected with Morgan on a pump-and-go route that resulted in an 80-yard touchdown. This time Tech kicked the extra point to draw within three. The ensuing onside kick was recovered by Auburn, and the Tigers ran out the clock to secure the 16-13 victory.
It’s easy to say, well, the model expected the Hokies to convert on the 11 points they left on the field. That would have lined up perfectly with the 24-16 score. I think a more accurate conclusion would be that the model expected both teams to land on the most likely outcome for points in regard to their opportunities, i.e. convert short field goals and score touchdowns from a yard out. Once I finish coding for predicted game stats, I may find that the model expected more or less penalties or turnovers, or perhaps more success passing or rushing by the Hokies, and that accounted for the predicted point differential.
How Useful is the Model?
All of the above serves as a prelude to this section, where we quantify the usefulness of the model. Again, I have only finished coding for the predicted points, but the variables will be similar or the same for the game stats. For example, instead of looking at Offensive Explosiveness, which is part of the points predict formulas, the model will include Passing Play Offensive Explosiveness in the passing yards predict formulas.
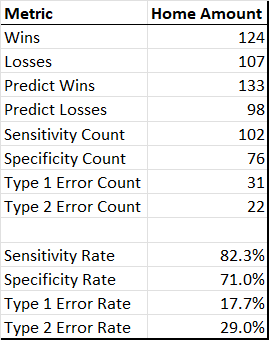
Overall, the top line game outcome (score prediction) stats for the home team in Virginia Tech games played since 2004 are as follows:

Keep in mind these definitions:
Sensitivity Rate - % of games the model picked the home team to win and the home team actually won
Specificity Rate - % of games the model picked the home team to lose and the home team actually lost
Type I Error Rate - % of games the model picked the home team to win and the home team actually lost
Type II Error Rate - % of games the model picked the home team to lose and the home team actually won
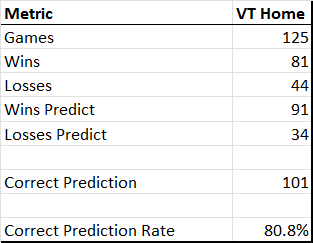
As a check against the model I used during the regular season, I looked at how often the model predicted the correct outcome of VT home games (the in-season model’s rate was 74.7% of all games when I launched it after the UNC game).

So, at least for home games, this model improves on the accurate game outcome rate of the previous model.
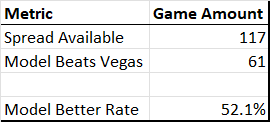
I also looked at how the model fared against Las Vegas with regard to predicting the game spread. Spread data is only available going back to 2012, but that sample size is sufficient to judge performance. Here I was pleased to find that the model (barely) outperforms those who actually put their money on the line in predicting outcomes:
In sum, this looks like a pretty useful model. It does very well at predicting expected outcomes, and most of the time the expected outcome aligned with the actual outcome. We can expect it to provide useful insights for each matchup in the Virginia Tech CFP, which will be key to understanding which VT team in the last 20 years was the best and, most importantly, why.


