

The 2022 Virginia Tech Defense - Not Vintage, but Improved
Answering the question, "How does the first Pry/Marve defense stand up to past VT defenses?" also reveals how wicked good many of Bud Foster's defenses were, just in case anyone forgot.

Note: Data are sourced from CFDB and ESPN, except where noted. On all bar charts, Maroon bars represent the 2022 defense coordinated by Chris Marve while orange represents the Justin Hamilton defenses and gray represents the Bud Foster defenses. On the cluster charts, maroon indicates the Virginia Tech defense and gray represents all other FBS defenses.
In recent days, Techsideline, both in article form and on their excellent podcast, did a great job putting the 2022 Virginia Tech offense’s futility in the proper historical context. My immediate follow-up question was, what about the defense? After all, it was that unit that was on the field for nearly 63% of the game on Saturday. We know that they generally start well then fade as they get worse down from being out on the field so much. But as a unit, 10 games into the season, how should we view this defense?
Firing Justin Fuente and hiring Brent Pry was never about improving the offense, but I think everyone, myself included, expected to see the defense take a step forward this year. And that is not just because Pry was a long-time defensive coordinator. In the short-term, most gains could be expected to come simply by returning to playing a defensive scheme very similar to Bud Foster’s. The current defensive players are a better fit for that scheme, so even absent any other improvement, Pry’s defense should perform at a higher level than Hamilton’s two units. So, the question is, have we seen that level of improvement? And if so, how does the 2022 defense compare to Bud Foster’s defenses?
To get to an answer, I examined the performance of Virginia Tech’s defenses since 2003 on a host of key advanced metrics. The results are illuminating, if not altogether surprising.
Stuff Rate
The stuff rate metric measures the percent of running plays on which the defense stops the running back at or behind the line of scrimmage. The 2022 team, which has been more than a little hot and cold when it comes to stopping the run, has hovered around the top of the FBS rankings in this measure. That’s part of how it graded out so well in the Pitt game despite allowing 300+ yards rushing to Israel Abanikanda. They actually stuffed him on a lot of plays. It’s just that on too many of the other plays he gained huge chunks of yardage.

The Hamilton defenses had, by far, the lowest stuff rates in the last 20 years. The 2022 team is in the top third, but well behind the 2004 team, which went a legit eight-deep along the defensive line. In fact, given the choice, I would take the 2004 second team defensive line over the 2022 starters.
Defensive Line Yards
The change in style from Bud Foster’s defense to Justin Hamilton’s called for defensive linemen to switch from shooting gaps to eating up blocks. Tech didn’t have the players to execute that consistently in 2020 and 2021, and it really shows in the defensive line yards, a metric that measures how a good a defensive line is at stopping the run. Running play weights for calculating defensive line yards are assigned as follows:
losses - 120%
0-4 yards from LOS - 100%
5-10 yards from LOS - 50%
11+ yards from LOW - 0+

The teams with lowest defensive line yards allowed generally had three things: depth, talent, and experience. The 2022 defensive line room is thin, moderately talented, and moderately experienced. As a result, it ranks in the bottom quartile among defenses from the last 20 years.
Defensive Second Level Yards
This metric measures the average yards per carry that are between 5 and 10 yards from the line of scrimmage. Primarily it is a measurement of linebacker effectiveness, but certainly there are elements of the defensive line (keeping backers free of blockers) and the secondary (attacking downhill).
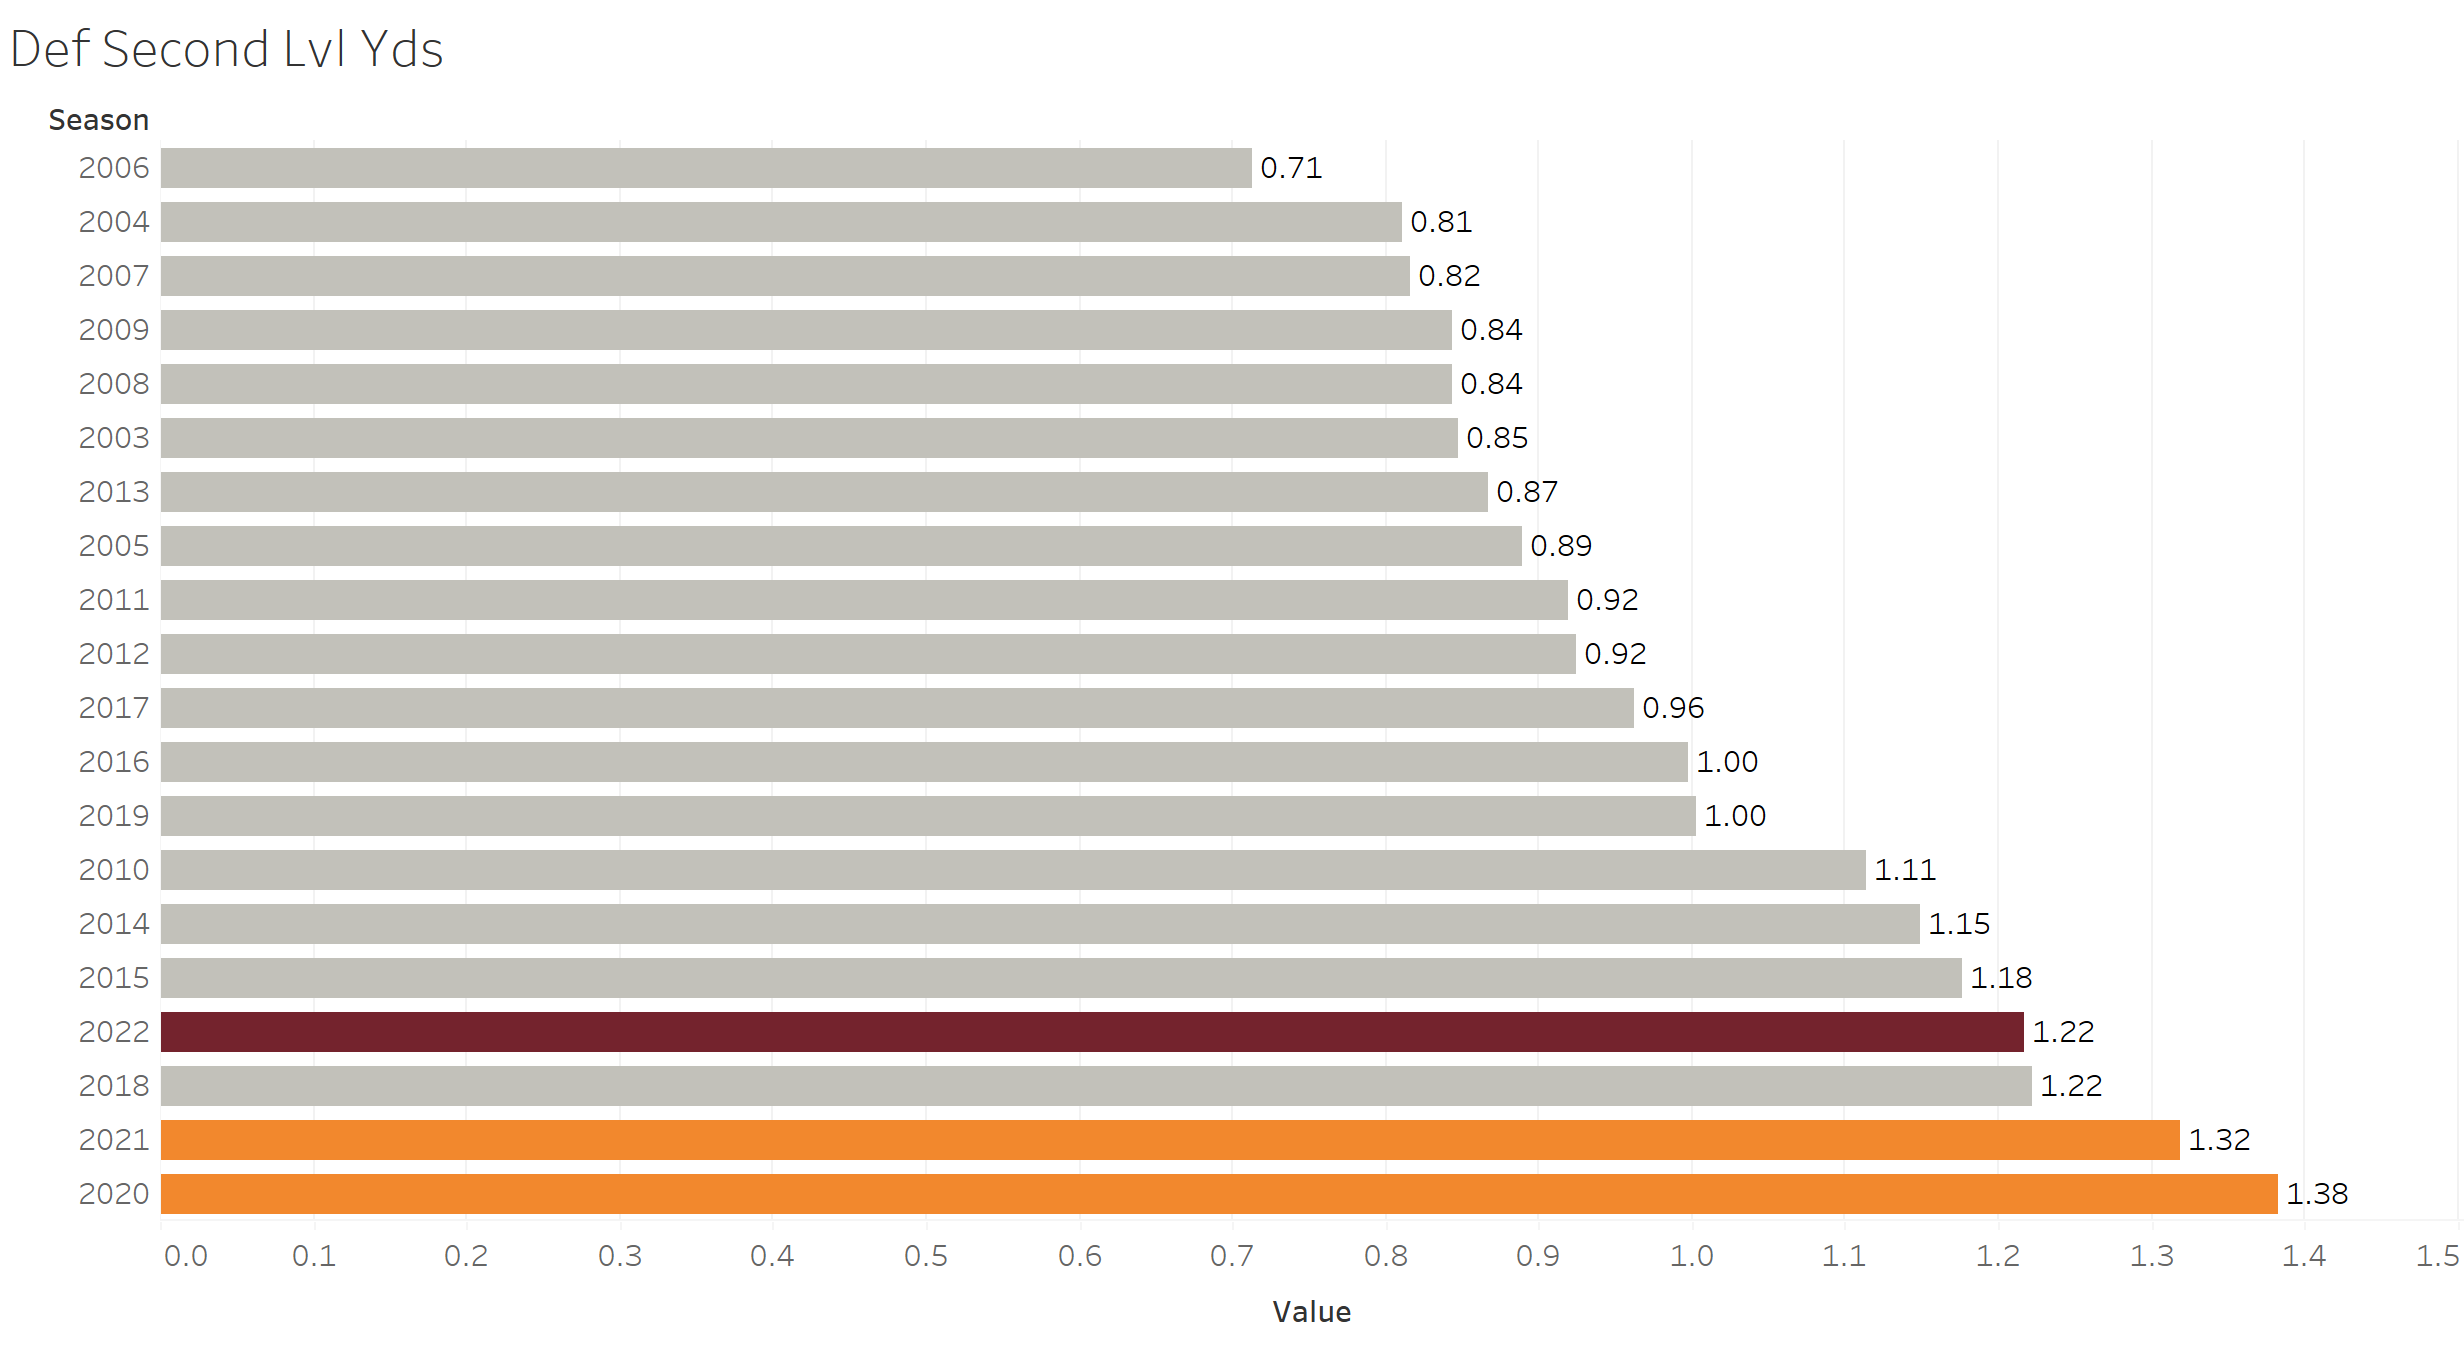
Not surprisingly, Vince Hall-Xavier Adibi teams capture the top three spots. The 2022 team has performed quite poorly compared to past Tech defenses, mainly, I think, due to the revolving door at the Will linebacker position. Had Alan Tisdale been eligible all season, I think the 2022 team’s performance would be much closer to that of the 2019 team.
Defensive Open Field Yards
The defensive open field yards metric measures the average yards per carry that come past 10 yards from the line of scrimmage. In other words, this metric measures the ability of a defense (generally defensive backs) to bring down a running back and prevent a 10-yard carry from becoming a 50-yard run. The 2022 Hokies are down a bit from 2021, but the current mark is far from the worst in the last 20 years, a distinction held by the 2018 defense.

The teams that score the best on this metric had experienced defensive backfields that took good angles and were sure tacklers. The 2007 secondary featured future NFL stars Brandon Flowers, Macho Harris, and Kam Chancellor. The spread on this metric is incredible - the 2022 team’s score is nearly 2.5 times higher than the 2007 team’s, and the 2018 team’s score is nearly 5x higher.
Defensive Success Rate
I wrote about success rate some last week in terms of the offense, but just as a reminder, successful plays are defined as:
the offense scored
1st downs which gain at least 50% of the yards to go
2nd downs which gain at least 70% of the yards to go
3rd and 4th downs which gain at least 100% of the yards to go
So, turning it around, the defensive success rate metric shows how good a defense is at getting the opposing offense “behind the chains”. The 2022 defense is better than the 2020 and 2021 units, but still in the bottom third among VT defenses since 2003.
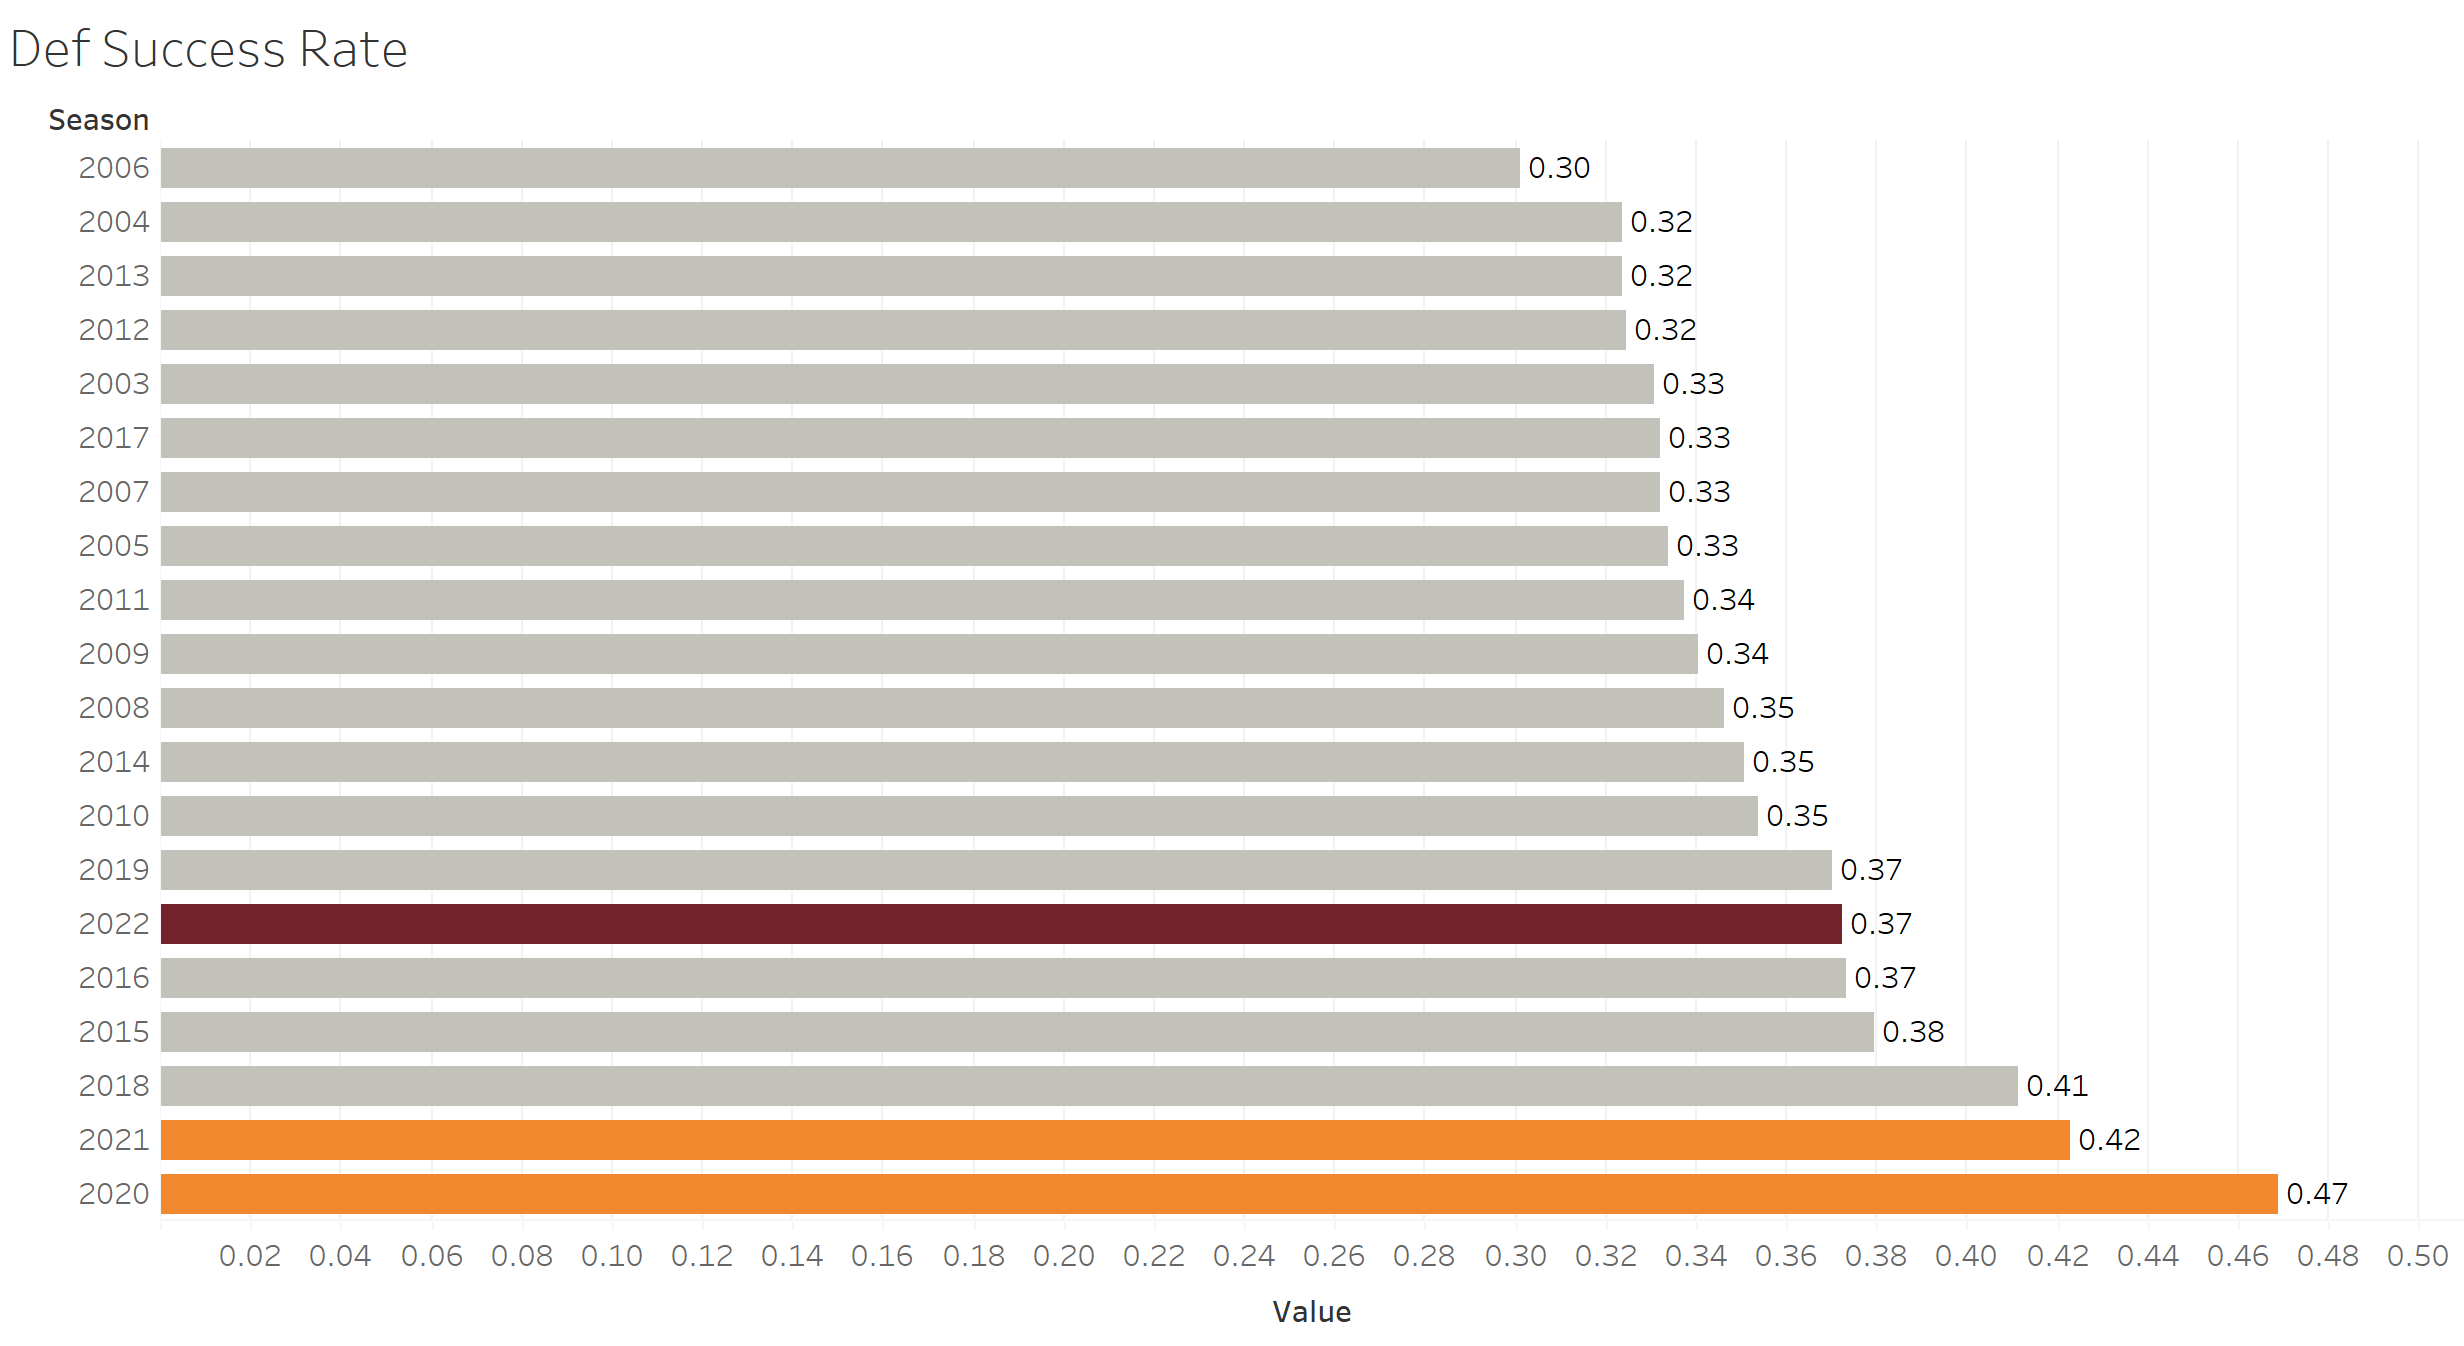
Both the 2005 and 2006 defenses were #1 in the nation in yards allowed per game, so I am surprised to see the 2006 defense score so much better than the 2005 unit on this metric. The 2022 team is about where one would expect it to be, based on what we have seen this season.
Defensive Explosiveness
Explosiveness measures the average EPA (more on how that is calculated below) on plays that were marked as successful. The metric shows how good a defense is at limiting big plays. The 2022 team is worse in this metric than every other VT defense of the last 20 years, except the 2018 unit.
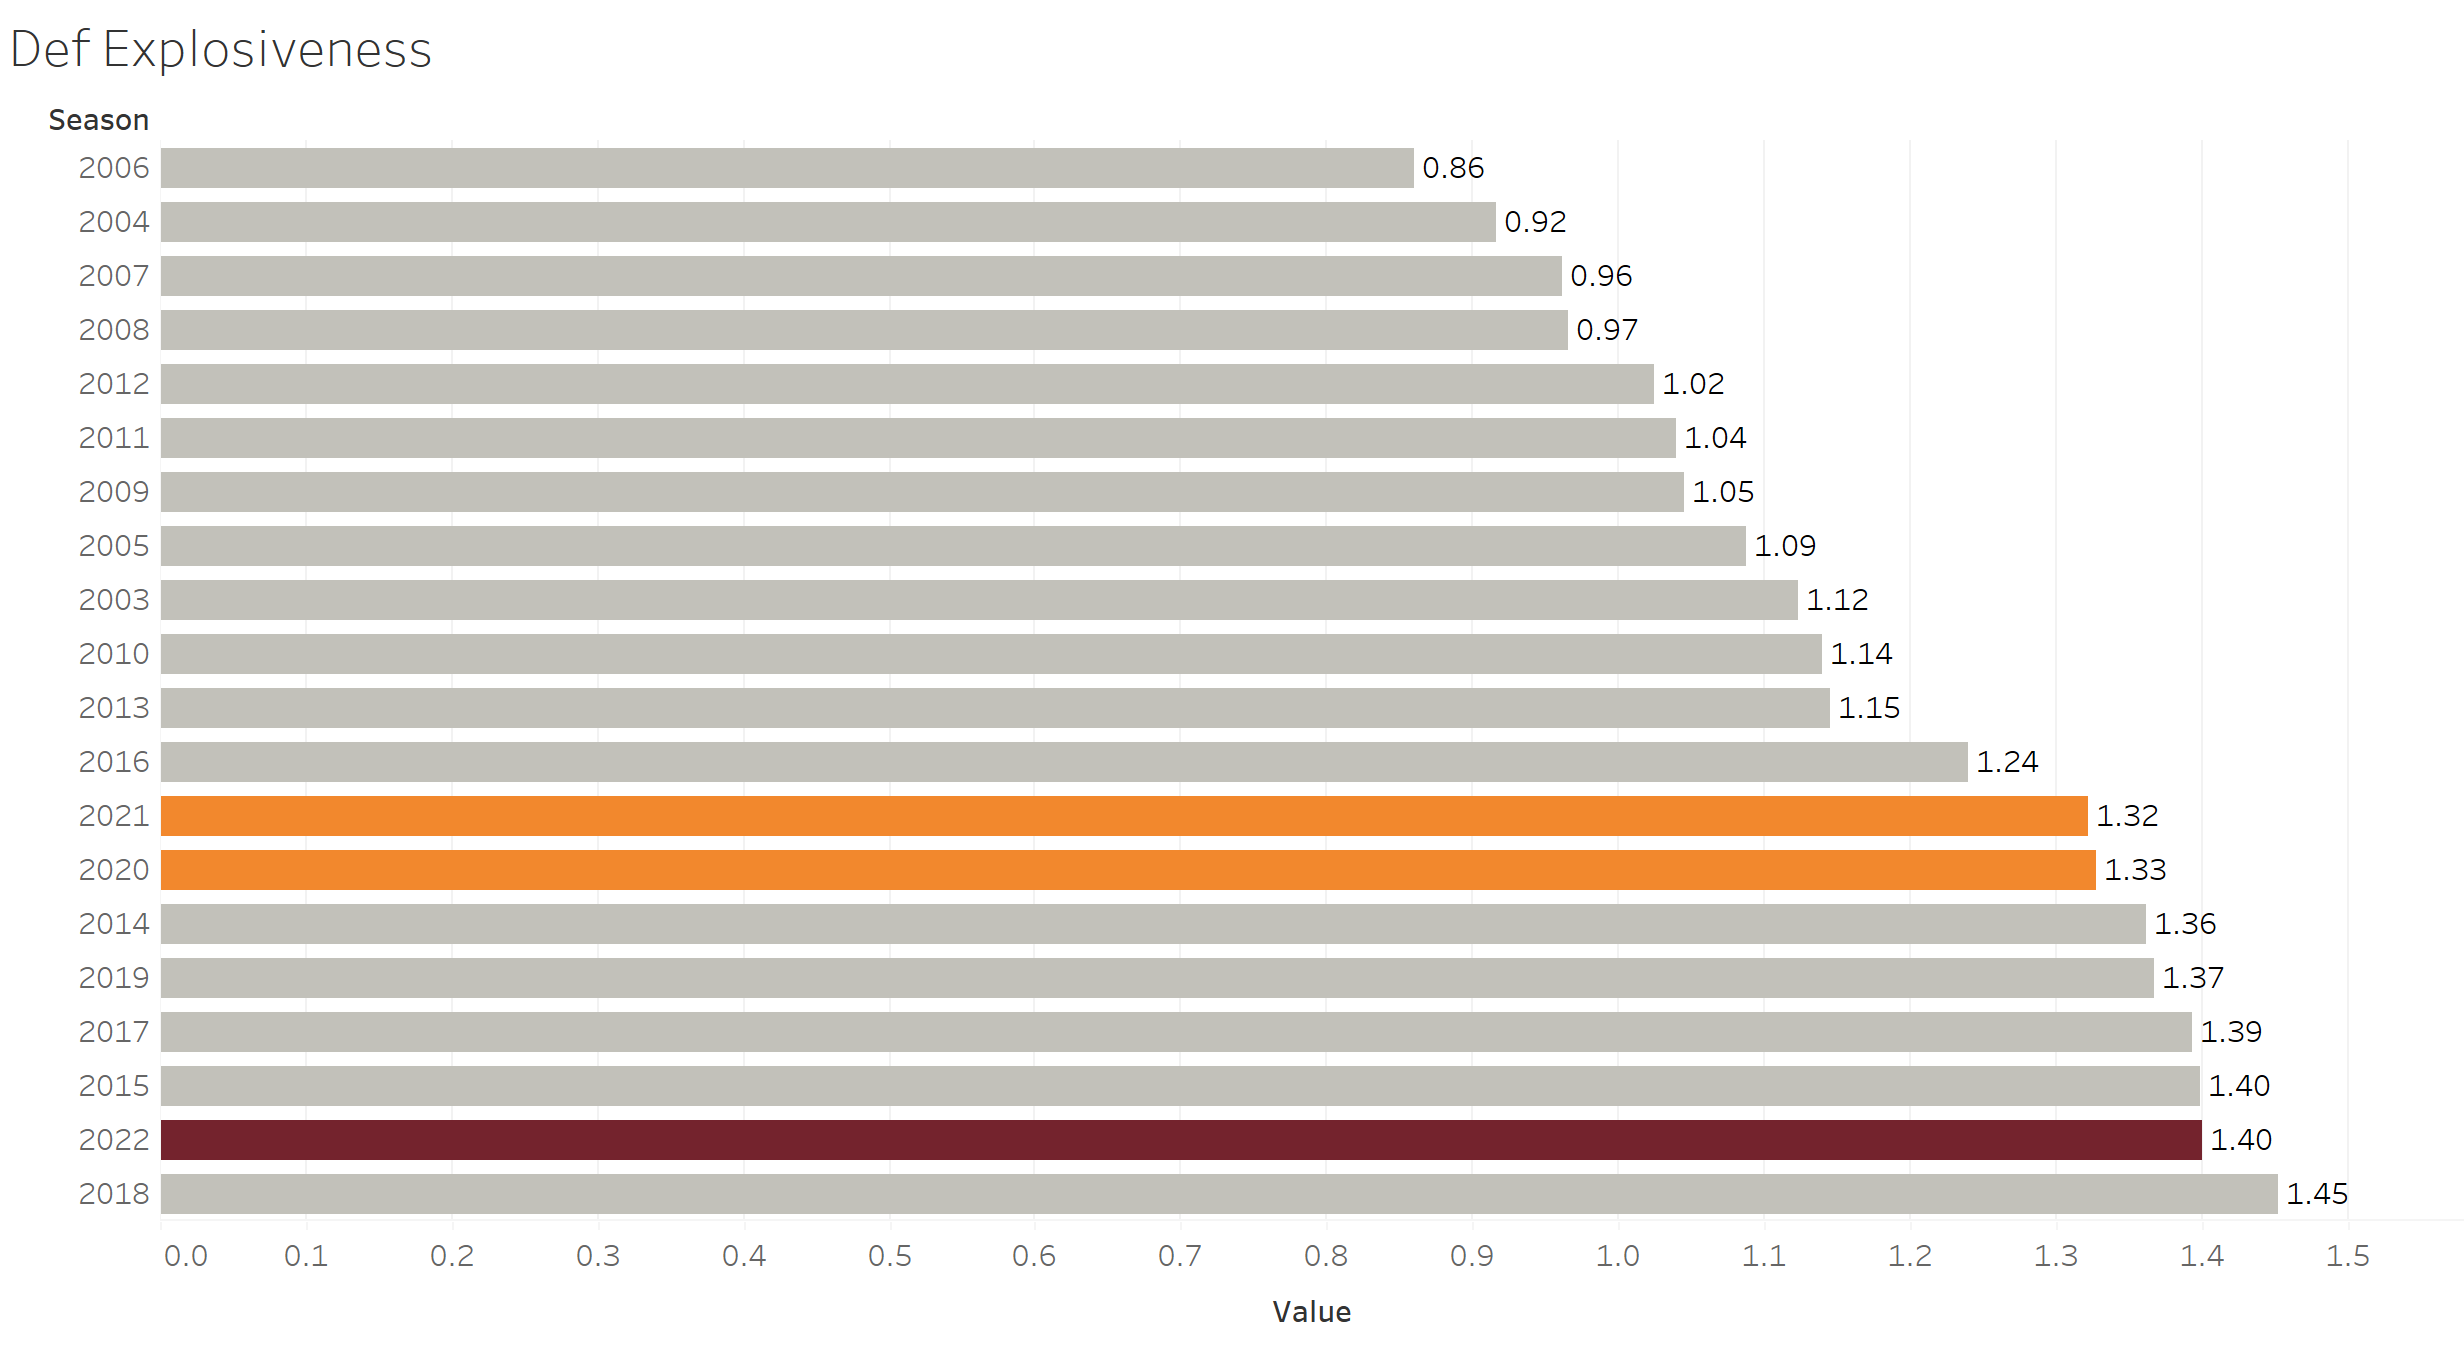
The usual suspects top this list, but notable is the fourth place 2008 defense, which comprised a lot of “no names” who were either early in their Tech careers (like future second round draft pick Jason Worilds) or career backups who finally cracked the starting lineup late in their careers (like linebackers Brett Warren and Purnell Sturdivant).
Defensive Expected Points Added (EPA)
EPA uses expected points to measure the outcome of a play. Expected Points (EP) assumes that not all yard lines are created equal. Each yard line is assigned a point value, and EP measures the number of points that would be expected to be scored based on down, distance, and field position. For defensive EPA, a negative value means that the team playing defense (Virginia Tech in this case) would be expected to score the next points in the game. EPA takes the EP value from the beginning of a play and subtracts it from the EP value resulting from the play.

Eight out of the seventeen Bud Foster defenses between 2003 and 2019 registered a negative EPA for the entire season, a testament if ever there was one to Bud’s true genius. However, among these great defenses, the 2004 unit was far and away the best, doubling the negative score of the 2003 team, which places second on this metric. The 2022 defense is in the bottom quintile, but significantly better than the 2020 and 2021 defenses.
In comparison to the rest of FBS in 2022, the Hokies are slightly above average in defensive EPA on rushing plays, and slightly below average on passing plays.

This year’s defensive EPA numbers are a reverse of 2021’s numbers. Last year the Hokies were slightly above average against the pass and well below average against the run.

Overall
The above metrics suggest that the 2022 defense lies in roughly the 25th percentile of all Virginia Tech defenses from the last 20 years. Still, there has been notable improvement on this side of the ball compared to the last two years. Of course, the 2020-21 defenses were playing a style that was not well suited to their personnel, something the offense is going through this year.
It will be a topic for another article, but I do think the low ranked 2020 and 2021 recruiting classes have had a negative impact on the 2022 defense. Too many first year players have had to play too many snaps this year. As such, the 2022 defense definitely had a low ceiling from the start. Still, there is a lot to like about the performance of many first-year players. If Pry can keep and develop these players, then add more talent in his next two recruiting rankings, we should see the 2023-5 defenses return to, roughly, the Bud Foster average from 2003-19.