
Below is the formula and a detailed explainer of the 247Sports metric Team Talent Composite, which I discuss at length in this episode.
This metric correctly predicted before the season even started that the Hokies would go 6-6. And while opt outs changed the complexion of the bowl game, the metric had picked the Hokies to lose that game anyway.
Still, this metric offers real insight into just how close the Hokies were to being a good team (e.g., 8-4 or 9-3), and it shows that even though Tech needed a win in the final game over UVA just to gain bowl eligibility, six wins was always the realistic floor.
Team Talent Composite
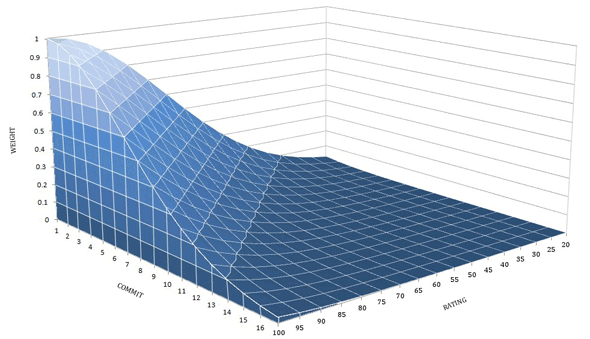
The Formula where c is a specific team's total number of commits and Rn is the 247Sports Composite Rating of the nth-best commit times 100.ExplanationIn order to create the most comprehensive Team Recruiting Ranking without any notion of bias, 247Sports Team Recruiting Ranking is solely based on the 247Sports Composite Rating.Each recruit is weighted in the rankings according to a Gaussian distribution formula (a bell curve), where a team's best recruit is worth the most points. You can think of a team's point score as being the sum of ratings of all the team's commits where the best recruit is worth 100% of his rating value, the second best recruit is worth nearly 100% of his rating value, down to the last recruit who is worth a small fraction of his rating value. This formula ensures that all commits contribute at least some value to the team's score without heavily rewarding teams that have several more commitments than others.Readers familiar with the Gaussian distribution formula will note that we use a varying value for σ based on the standard deviation for the total number of commits between schools for the given sport. This standard deviation creates a bell curve with an inflection point near the average number of players recruited per team.Below is a graphical representation of how our formula works. You can see that the area under the curve gets smaller both as the rating for a commit decreases and as the number of total commits for a school increases. The y-axis in this graph represents the percentage weight of the score that gets applied to an overall team ranking.